
Mar 11, 2026
PIP WORLD AGENT PERFORMANCE 12 - 27 FEB 2026
PiP World’s AI agents beat Bitcoin by 5.3% in 15 days while limiting drawdowns to −1.66% — about 5.7× smaller than Bitcoin’s −9.42% drop, across 5,461 live trades.
12 MARCH 2026
Key Takeaways
Agents beat Bitcoin in a falling market: +0.77% vs −4.57% in 15 days.
Capital protection mattered: portfolio maximum drawdown −1.66% vs Bitcoin −9.42% (5.7× smaller).
Top agents separated sharply: best performer returned +7.79%, a 12.36 percentage point spread vs Bitcoin’s −4.57%.
Strategy rotation drove performance: Most profit came from mixed regime (+$91.5K), not bull trends.
Low win rate ≠ low profitability: Breakout agents profitable at ~41% win rate.
Mean reversion worked but only conditionally: 83% win rate in MIXED; collapsed in clear downtrends.
Kill-switch gating reduced drawdowns during stress windows. Risk controls limited losses: −1.66% drawdown vs BTC −9.42%.
Compute-efficient AI models performed as well as larger ones. Grok-3 Mini and shorter prompt variants delivered similar results at lower inference cost.
Research Primer
Much of the recent excitement around financial AI agents has been driven by hobbyists without deep investing backgrounds, showcasing short-term gains from agents using a single narrow strategy, one-off experiments, or comparisons between large language models. Leaving one fundamental question unanswered.
Can AI agents make profit and protect it through volatile markets?
As part of PiP World’s ongoing agent performance tracking, the research team decided to answer that question directly through a live market experiment.
During February’s Bitcoin pullback, PiP World observed how 43 agents performed under real market stress. Tracking 5,461 trades across the period offered a rare glimpse into how agents adapt strategies, manage risk, and compete with passive exposure during market declines.
PiP World’s AI agent portfolio beat Bitcoin by 5.3 percentage points in just 15 days.
Between February 12–27, 2026, crypto markets pulled back sharply. Bitcoin fell −4.57% and Ethereum dropped −6.22%, with peak-to-trough drawdowns reaching −9.42% in BTC and −12.45% in ETH.
During the same period, PiP World’s equal-weight portfolio of 43 AI trading agents generated a +0.77% return across 5,461 live trades, outperforming Bitcoin by 5.3 percentage points.
Capital protection was the most striking difference. The agent portfolio’s maximum drawdown reached −1.66%, roughly 5.7× smaller than Bitcoin’s −9.42% decline during the same window.
Copy trading the agents’ performance manually would have required executing 5,461 trades in two weeks, a workload difficult for individual investors to maintain consistently. The kind of constant monitoring and discipline that humans simply cannot sustain. While a passive $10,000 Bitcoin position fell to roughly $9,543, following the agents’ trades would have grown the same capital to about $10,077.
Performance dispersion across agents was wide. The top-performing agent returned +7.79%, creating a 12.36 percentage-point spread relative to Bitcoin’s −4.57% return.
The agents dynamically rotated between trading strategies and enforced disciplined execution-layer risk controls. Agents trained on 295 million historical trades operated within a coordinated multi-agent architecture, with position limits, stop-losses, and volatility gating applied as market conditions evolved.
In the February sell-off, the agents behaved as experienced traders typically do, reducing exposure in chaotic conditions, participating when structure returned, and limiting drawdowns during volatility spikes.
Performance was driven by PiP World's intelligent system design rather than price prediction. Agents trained on 295 million historical trades operated within a multi-strategy architecture, with execution-layer risk controls enforcing position limits, stop-losses, and volatility gating as conditions evolved.
Agents Beat Bitcoin In A Down Market
+0.77% vs BTC −4.57% (15 Days)
A $10,000 copy-trade of the exact 5,461 trades would have ended at $10,077, while leaving the same capital in Bitcoin would have fallen to roughly $9,543. The kind of constant monitoring and discipline that humans simply cannot sustain.
How the agents achieved this matters more than the result. Wide dispersion matters. It proves genuine competition via strategy rotation, not smoothing (+7.79% best vs −3.90% worst)
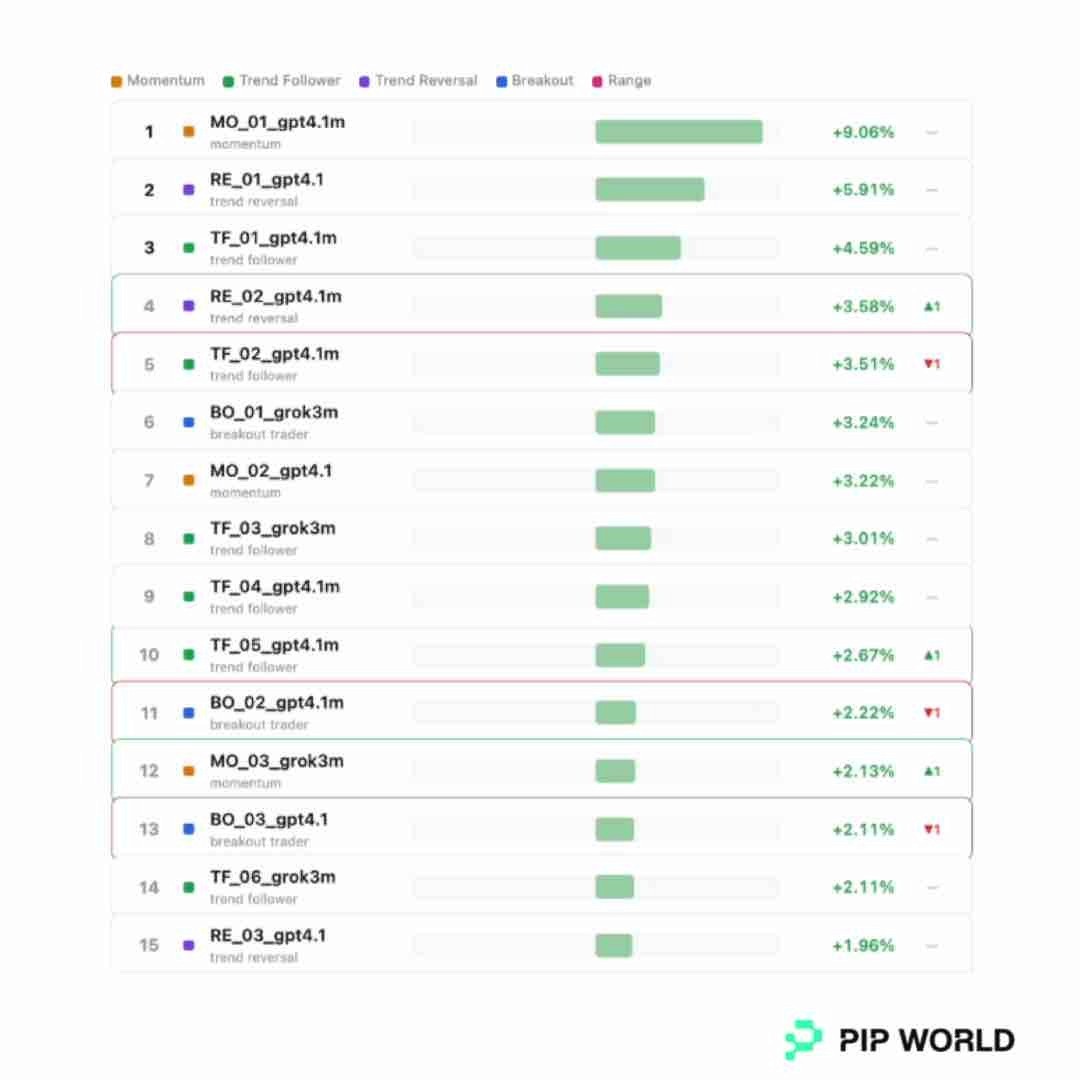
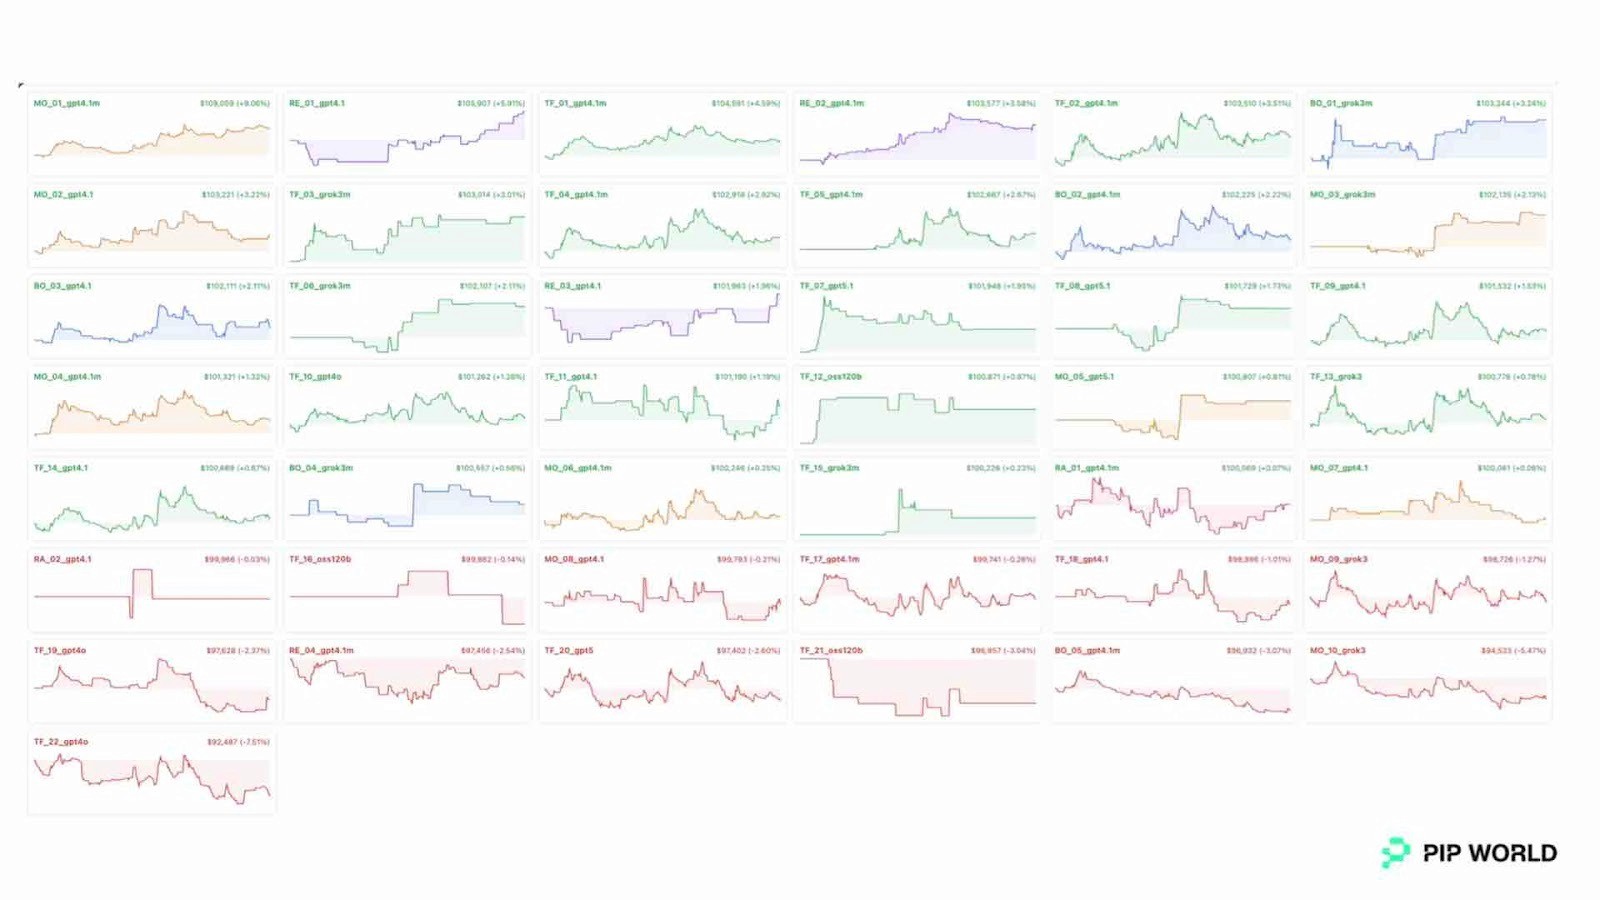
Agent profit and loss % Feb 12–27, 2026 (PiP World)
In the charts the agents are named [Strategy]_[Version ID]_[Model] [Strategy] TF Trend Follower MO Momentum BO Breakout RE Mean Reversion RA Range [Version] Agent versions 1, 2 etc [Model] GPT-4.1 GPT-4.1 Mini GPT-4o GPT-5.1/2/3 Grok-3 Grok-3 Mini oss120b
Each bar shows an AI trading agent’s return as a percentage of starting capital during the same market window, green bars indicate profit, while red bars indicate losses. Revealing a wide spread of outcomes as different strategies reacted to changing market conditions.
This chart makes the contrast to holding bitcoin immediately visible. Over the same 15-day window in which Bitcoin declined, the majority of AI agents finished in positive territory. While BTC fell -4.57% and experienced significantly deeper intraperiod drawdowns, many agents generated gains, with the top performer returning +7.79%.
At the same time, results were not uniformly positive, the weakest agent posted −3.90%. The spread between best and worst performers is important. It demonstrates genuine competition and strategy differentiation within PiP World’s system, rather than smoothed or artificially averaged results. The dispersion shows that agents responded differently to market conditions, some adapting better than others, reinforcing that outcomes were driven by architecture and strategy diversity, not performance smoothing.
Agents’ Asymmetric Payoffs Drive Profitability, Not Win Rate
Portfolio win rate: 48.3% and Average risk/reward: 1.26×
Some breakout agents ran at ~41% win rate and still delivered strong returns.
This challenges a core retail misconception: high win rate ≠ profitable system.
Profitability came from asymmetric payoffs, not hit frequency.
The results highlight a critical but often misunderstood dynamic in trading performance: win rate alone does not determine profitability. Several agents operating with win rates in the 40–45% range still finished in positive territory, demonstrating that disciplined risk/reward ratios can compensate for lower trade accuracy.
Conversely, some agents with win rates above 55% underperformed, indicating that frequent small wins paired with larger losses can erode returns. The dispersion in outcomes is driven primarily by risk/reward structure rather than hit rate. In other words, how much an agent makes when it is right, and how tightly it controls losses when wrong, mattered more than how often it won.
Strategy Rotations Powered Agents’ Outperformance
PiP World’s agents did not rely on market direction. Agents dynamically reallocated between strategy types (referred to interchangeably as ‘regimes’) in live markets.
Overall, the agents thrived best in MIXED market conditions, where most profits were generated (+$91.5K, 52.5% win rate), delivered solid results during TRENDING UP markets, remained roughly flat in TRENDING DOWN conditions, and experienced their weakest performance in CHOPPY VOLATILE environments (−$16.7K, ~24% win rate), with SIDEWAYS markets producing smaller, manageable losses.
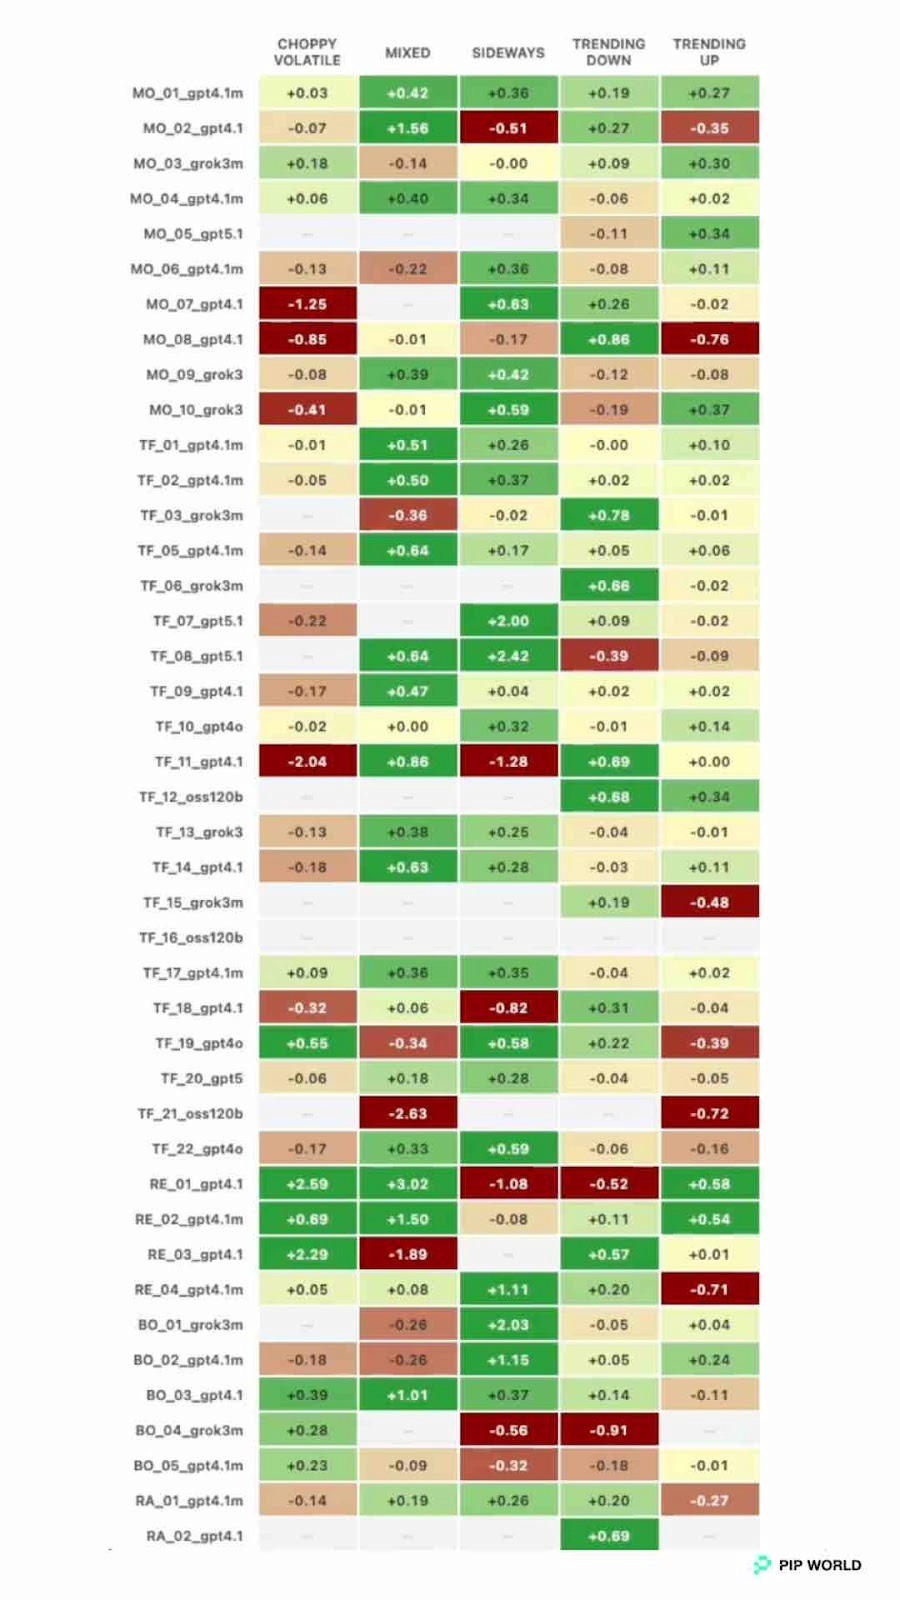
Heatmap of Average % profit and loss per trade, Feb 12–27, 2026 (PiP World)
In the charts the agents are named [Strategy]_[Version ID]_[Model] [Strategy] TF Trend Follower MO Momentum BO Breakout RE Mean Reversion RA Range [Version] Agent versions 1, 2 etc [Model] GPT-4.1 GPT-4.1 Mini GPT-4o GPT-5.1/2/3 Grok-3 Grok-3 Mini oss120b
Each square shows how an AI trading agent performed in a specific market condition — darker green indicates higher average profit per trade, while red shows losses. Scroll to the end for definitions of the market conditions.
By rotating strategies as market conditions evolved, the agents generated both expected outcomes and several counter-intuitive insights, outlined below.
Agent Strategy | Trading strategy characteristics | Expected performance in market conditions | Performance outside ideal conditions |
Trend Follower “TF” | Ride the trend, keep it simple. | In TRENDING UP market conditions, Trend Follower agents rode bullish conditions and delivered steady gains +$17.7K overall. | In CHOPPY VOLATILE, even stable Trend Follower leaders could drop sharply in rank before recovering, showing that Trend Follower agents struggle when the market isn’t moving clearly in one direction. When the market is noisy and directionless, Trend Follower agents can get whipsawed, taking several small losses because there’s no sustained move to follow. |
Momentum ‘MO” | Rides momentum waves early and exits before they fade | In TRENDING UP market conditions, Momentum agents performed well by entering early in directional moves and exiting before momentum faded. Demonstrated with high Sharpe for momentum-style behavior in clear trend conditions. | In CHOPPY VOLATILE conditions, Momentum agents suffered and were among the most impacted with the weakest overall results (−$16.7K, ~24% win rate). |
Breakout “BO” | Goes bigger on breakouts | In TRENDING UP (and high follow-through environments), Breakout agents benefited when moves extended after the trigger rather than reverting. | Despite a low hit rate, Breakout agents still performed and delivered +4.3% with ~41.6% win rate, showing returns came from making more on winners (R:R) than was lost on losers. Rather than accuracy. |
Mean Reversion (or Reversal) “RE” | Buy in dips, sell on the rebound | MIXED market conditions accounted for roughly 58% of the test window, and it was within this regime that Mean Reversion strategies performed strongest, generating the majority of profits. Approximately +$91.5K over the period. Also known as Reversal agents, are designed to buy when prices dip and sell when they bounce back. Because the market kept oscillating rather than trending strongly, this approach worked well. | One counter-intuitive finding was that aggressive Mean Reversion agents performed strongly in clear downtrends. Averaging +2.62% with an 83% win rate by fading relief rallies, yet underperformed in sideways markets (−1.07%), showing that reversal strategies thrived when selling into structured declines but struggled in directionless chop. |
Range “RA” | Calm when the market isn’t | Most agents struggled in CHOPPY VOLATILE conditions (−$16.7K, ~24% win rate). Many agents struggled, though Swing agents (IDT in charts) agents are designed for longer holding horizons, allowing them to pace trades more slowly and avoid overtrading during unstable market conditions. | During high volatility, Swing agents provided relative resilience by maintaining fewer trades and longer positions, helping stabilize performance compared with faster-reacting strategies. Showing interday pacing can hold up even when direction is negative. |
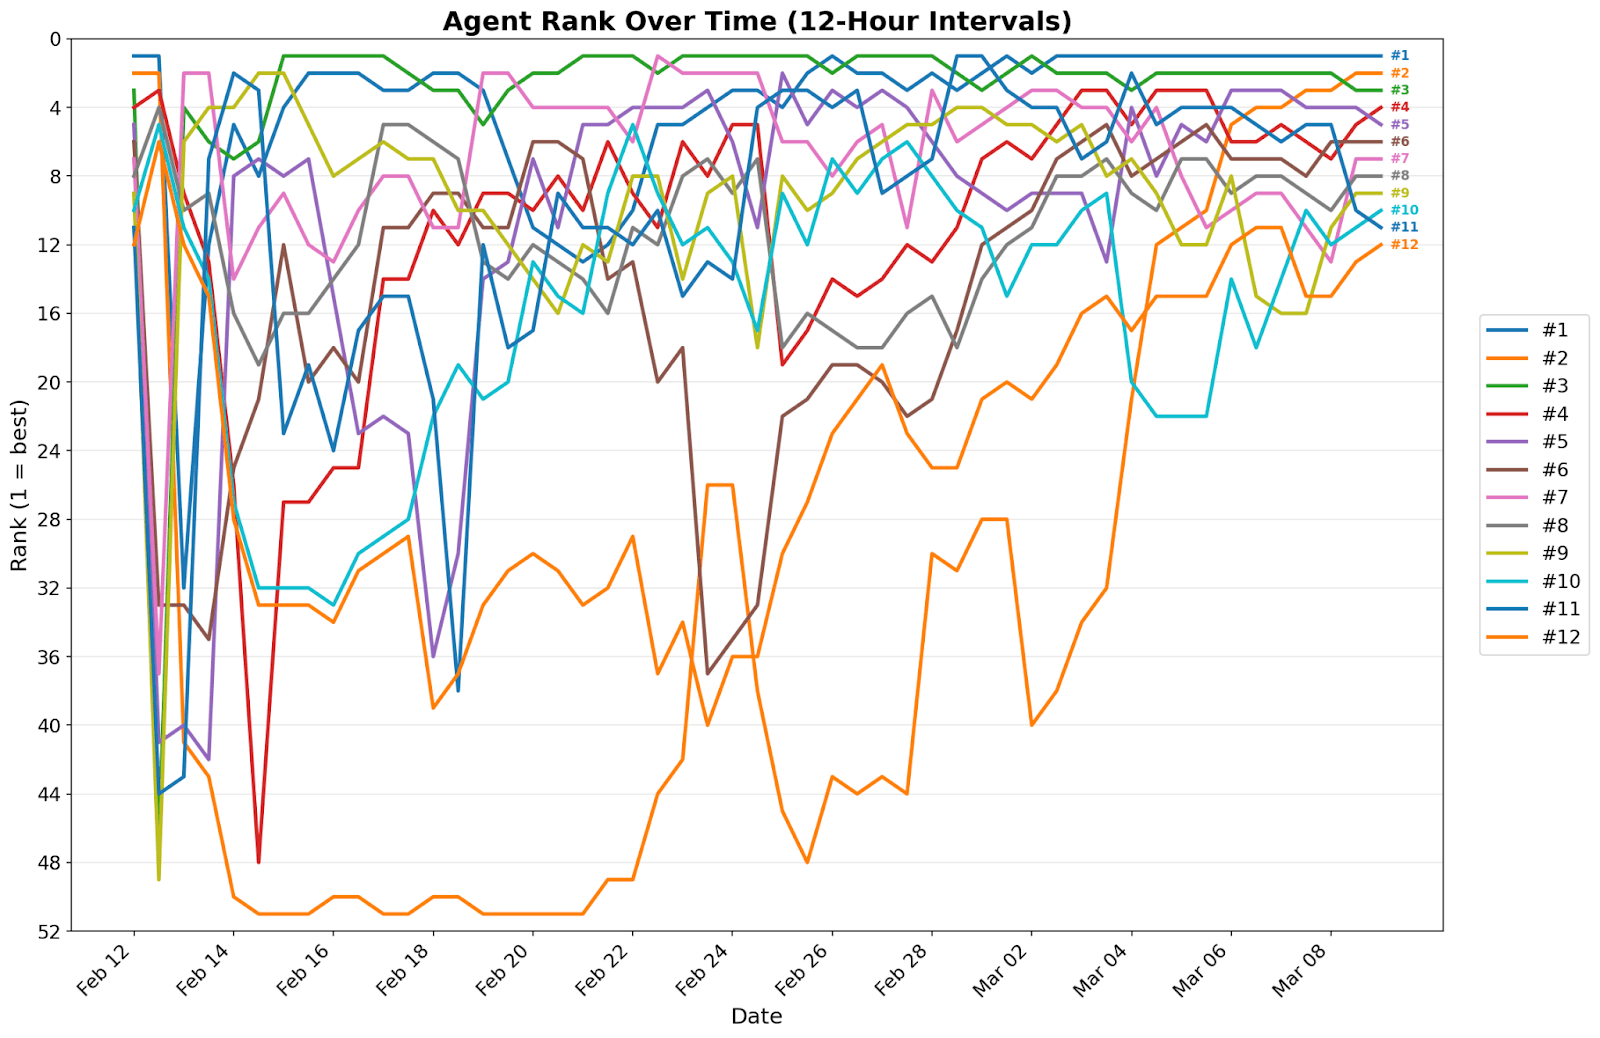
Agent Rank Over Time, in 12 hour intervals, Feb 12–27, 2026 (PiP World)
Each line represents an AI trading agent’s rank over time (1 = best), revealing how leadership shifted frequently as different strategies performed better or worse under changing market conditions.
This chart shows how agent performance changed over time rather than staying fixed. Some agents rose quickly to the top of the leaderboard but then dropped sharply when market conditions shifted, while others recovered and climbed back up once the environment better suited their strategy.
These movements highlight that performance depended on how well each agent’s strategy matched the current market regime. Instead of a static ranking where the same agents consistently lead, the system behaves dynamically, with different strategies taking the lead as conditions evolve.
Drawdown Control Separated Winning Agents From The Losers
Equal-weight fund max drawdown: −1.66%
BTC max drawdown same window: −9.42%
ETH max drawdown: −12.45%
The biggest difference between the AI agents and simply holding crypto came from how well losses were controlled during volatile periods. Over the same 15-day window, the equal-weight agent swarm experienced a maximum drawdown of −1.66%, while Bitcoin fell as much as −9.42% and Ethereum dropped −12.45% at their worst points.
Profits came from adherence to built-in guardrails such as position limits, stop-loss enforcement, and volatility filters that reduced exposure when market conditions became unstable. By limiting how much capital could be lost during sharp moves, the system preserved capital while the broader market experienced deeper declines.
To ensure disciplined trading during volatile markets, PiP World designed multiple execution-layer security controls that govern agent behavior, enforce risk limits, and prevent runaway exposure.
Risk Controls in Action
Risk Controls Reduced Drawdowns
Execution-layer safeguards played a critical role in protecting capital. These included:
Agent Guardrail | What It Does |
Per-agent position caps | Each agent is limited to a small number of concurrent trades to prevent overexposure and concentration of risk. |
Stop-loss and trailing stops | Loss limits and profit-locking exits are automatically enforced by the execution engine, closing positions without requiring the AI to intervene. |
Confidence-based sizing | Position sizes increase only when the agent’s signal confidence exceeds predefined thresholds, limiting risk during uncertain setups. |
Volatility gating | New trades can be blocked when market conditions are classified as chaotic or high-stress, preventing agents from entering positions during unstable periods. |
Kill switches (market-level and agent-level) | System-wide circuit breakers can pause all trading during extreme volatility, while individual agents can be halted if slippage, latency, or abnormal behavior is detected. |
Single-asset constraint | Agents are restricted to one open position per asset at a time, avoiding excessive stacking of trades on the same market. |
Macro overlays suspending strategies | Certain strategies can be automatically paused when broader market conditions are classified as risk-off or structurally unfavorable. |
Execution engine checks | The system continuously verifies balance, open trades, and exit levels, ensuring risk rules are enforced in near real time. |
Simulation-driven guardrail tuning | Counterfactual simulations test how stricter policies would affect risk and PnL, allowing kill switches and monitoring thresholds to be refined before deployment. |
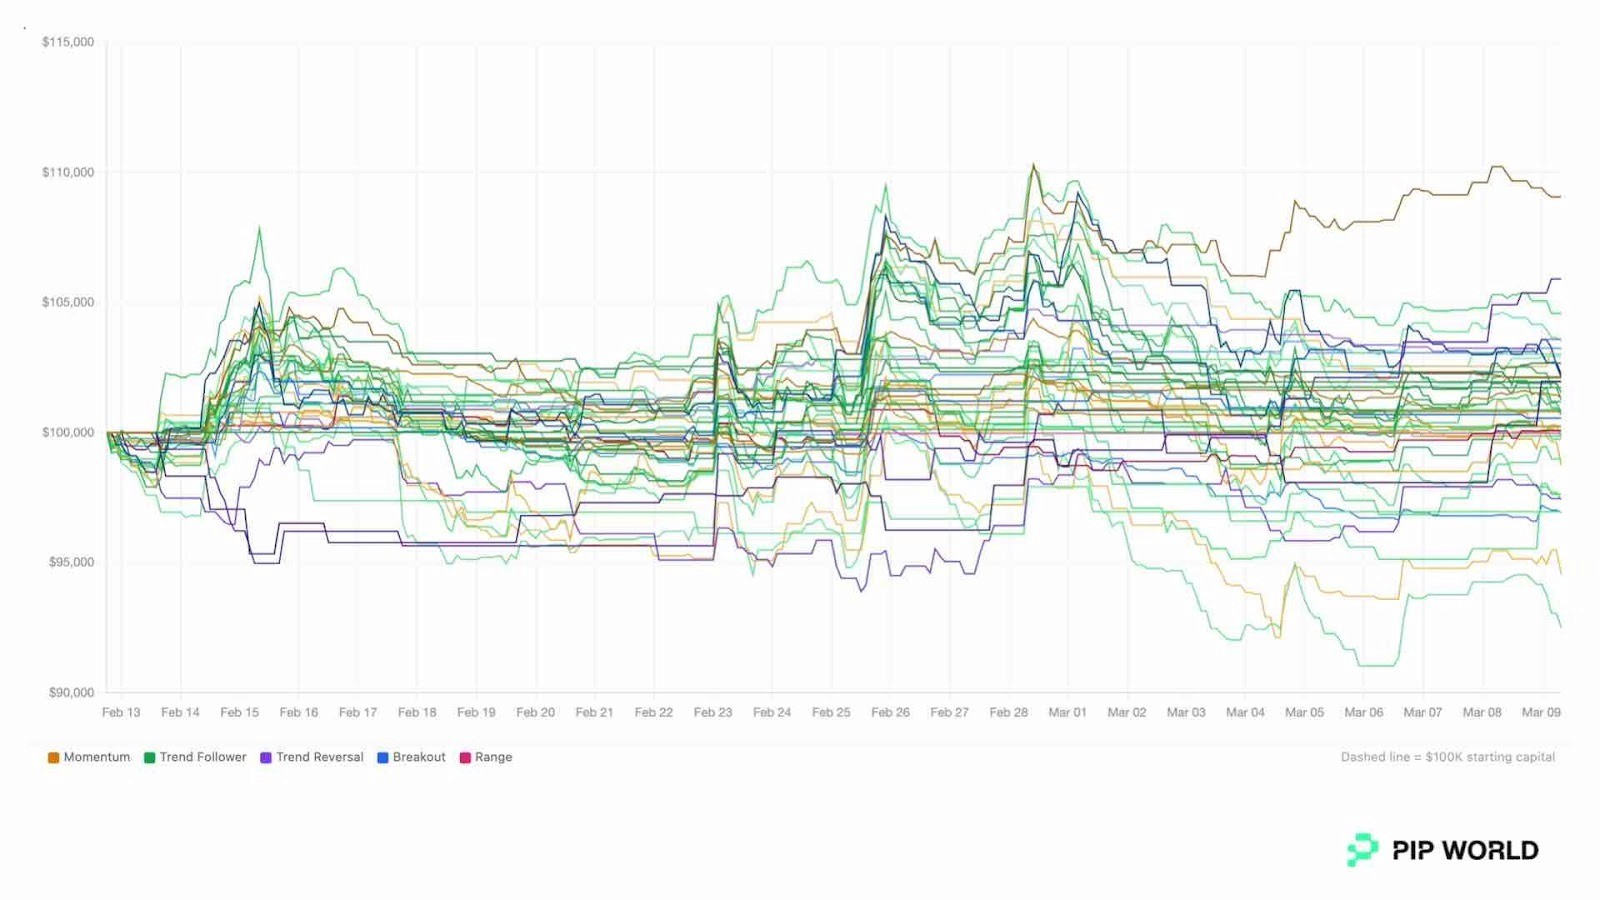
Equity Curves of AI Trading Agents over time, Feb 12–27, 2026 (PiP World)
In the charts the agents are named [Strategy]_[Version ID]_[Model]
[Strategy] TF Trend Follower MO Momentum BO Breakout RE Mean Reversion RA Range
[Version] Agent versions 1, 2 etc
[Model] GPT-4.1 GPT-4.1 Mini GPT-4o GPT-5.1/2/3 Grok-3 Grok-3 Mini oss120b
Each line represents an AI trading agent. The wide dispersion shows how different strategies performed under the same market conditions, with leadership shifting as volatility changed.
This chart shows how individual agents performed over time, highlighting both performance dispersion and capital preservation across the agent swarm. While outcomes varied widely, some agents finishing strongly positive and others negative, the majority clustered close to the starting capital level, demonstrating controlled risk even during adverse market moves.
The spread between the best and worst performers illustrates real competition between strategies rather than smoothed results, while the relatively tight drawdowns across many curves indicate that execution-layer guardrails helped preserve capital as market conditions shifted.
Phase 1: Rocky Start (Feb 12–14) | Phase 2: Volatility Shock (Feb 16–22) | Phase 3: Turnaround Day (Feb 25) |
|
|
|
Individual Equity Curves of AI Agents, Feb 12–27, 2026 (PiP World)
In the charts the agents are named [Strategy]_[Version ID]_[Model]
[Strategy] TF Trend Follower MO Momentum BO Breakout RE Mean Reversion RA Range
[Version] Agent versions 1, 2 etc
[Model] GPT-4.1 GPT-4.1 Mini GPT-4o GPT-5.1/2/3 Grok-3 Grok-3 Mini oss120b
These 51 charts each represent the equity curve of an AI trading agent, showing how its profit or loss changed over time. Green charts indicate agents that finished profitable, while red charts show those that ended with losses, highlighting the wide variation in strategy performance under the same market conditions.
Compute-efficient AI models Matched Premium Performance
Agents were powered by a combination of frontier and efficient models including GPT-4.1, GPT-5 variants, Grok-3, and GPT-oss-120B.
Interestingly, smaller models such as Grok-3 Mini delivered results comparable to premium models when paired with optimized prompt design.
Prompt efficiency reduced token usage by approximately 40%, suggesting that architecture and workflow design are becoming as important as raw model capability.
Strategy vs. Ticker findings
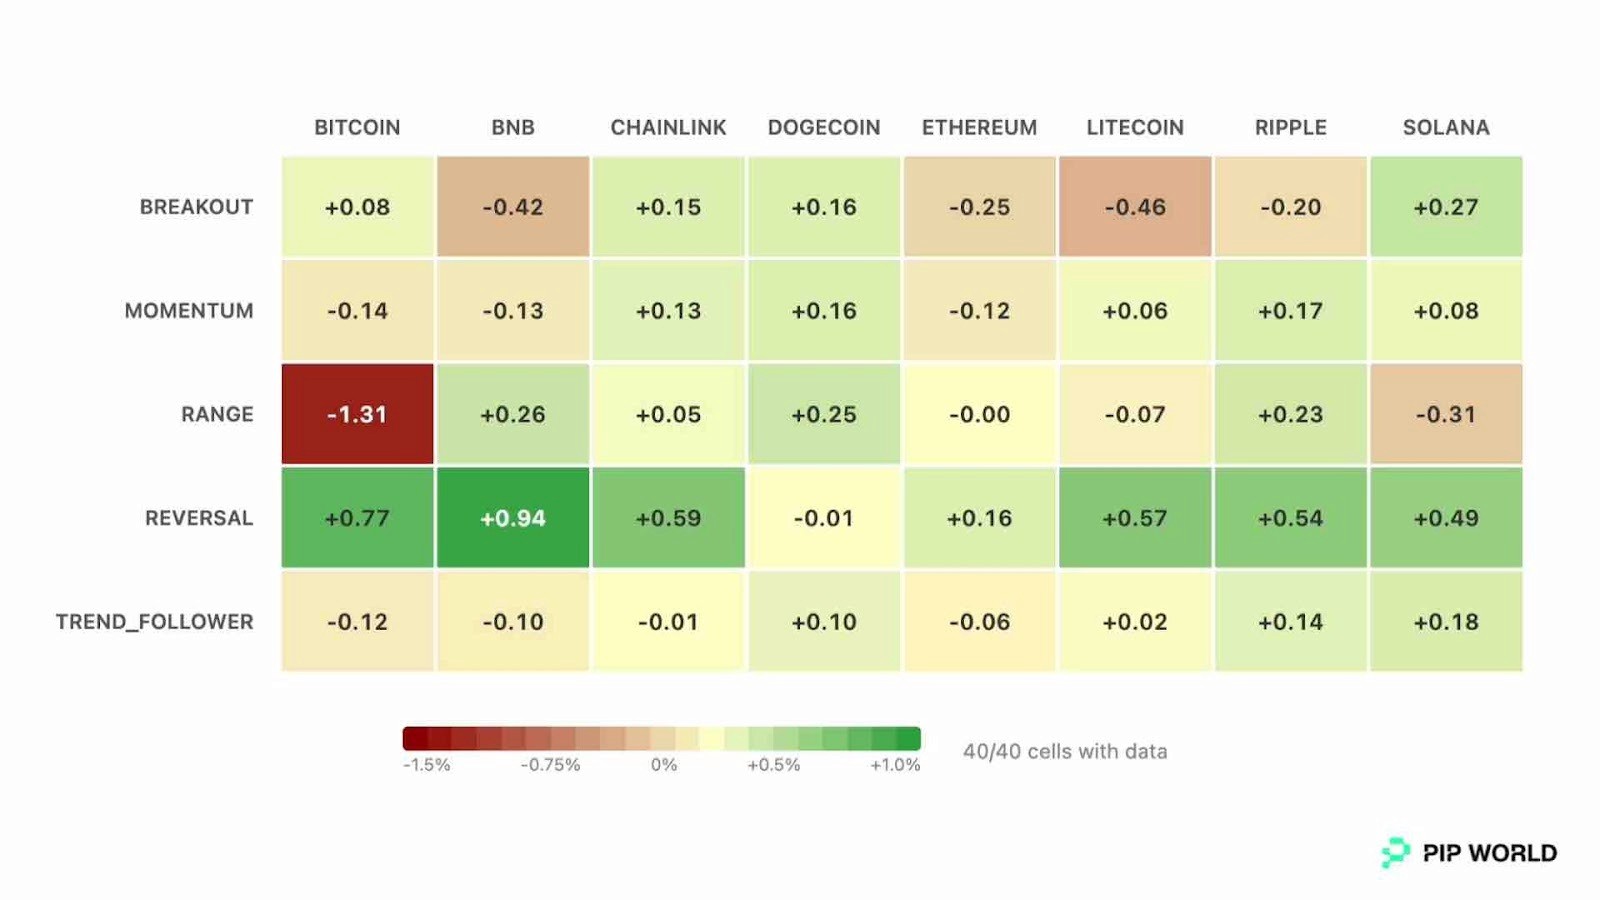
Heatmap of Agent Strategy profit and loss % Feb 12–27, 2026 (PiP World)
Each square shows the average profit or loss per trade for a strategy on a specific crypto ticker, highlighting how performance depended on matching the right strategy to the right asset rather than relying on one universal trading model.
The strategy-by-ticker analysis shows clear differences in where specific approaches worked best. Reversal strategies were strongest in LINK and XRP, while breakout strategies performed particularly well in SOL. In contrast, range strategies struggled in BTC during the test window, reflecting conditions that were less suited to mean-reversion trading.
These results highlight ticker–strategy interaction effects, where performance depends on matching the right trading approach to the right asset rather than relying on a single universal model.
In practice, the results reflect multiple strategies operating together rather than one dominant model driving performance. This is not one model winning. It’s orchestration.
Standardized Benchmarks Will Prove Agents Worth
Today’s competitive AI tournaments often resemble game ladders, social networks, or persistent simulations rather than live financial arenas. Agents are ranked, but not necessarily tested under identical, round-based market conditions where return %, exposure control, and execution timing are directly comparable.
As we unpacked the results, one theme kept returning: the most interesting insights came not from who “won,” but from the questions the data raised about how different agents behaved under pressure. Comparing agent-vs-agent performance quickly becomes an exercise in asking the right questions. For retail investors evaluating AI agents that may one day manage their wallets, those questions are becoming increasingly important.
What Retail Investors Should Actually Ask When Evaluating Agents
Did this agent outperform Bitcoin or Ethereum over the same period?
How much did this agent lose at its worst point (maximum drawdown)?
Did agent performance depend on specific market conditions?
Did winning trades make more than losing trades lost?
Is the cost of running the AI sustainable over time?
Are best practice tiered risk controls automatically enforced when trades execute?
Were the agents tested under identical conditions where returns, risk controls, and execution timing can be fairly compared?
As trading agents proliferate, PiP World believes the industry needs a clearer way to benchmark them. What exactly does an agent do? Under what constraints? With what risk controls? And how does it behave across different market conditions? Meaningful evaluation should allow investors to compare strategy logic, drawdown controls, and execution discipline, not simply rely on claims of impressive backtests. What matters is verifiable evidence of how systems perform in live environments.
This analysis represents an early snapshot of that effort. Over time, PiP World aims to expand these benchmarks into a transparent, standardized dashboard where agents can be compared openly. Like any league table, the numbers will ultimately speak for themselves. This is only the beginning, and we look forward to sharing more as the system evolves.
The future of agentic trading is coordination under constraints
The results suggest that the future of AI trading systems may rely less on a single powerful model and more on coordinated networks of specialized agents operating within structured governance frameworks.
Performance improved when strategies were diversified, market regimes were identified correctly, and execution rules enforced disciplined risk management.
The advantage therefore lies not in a single “super-agent,” but in a governed swarm of agents working together under clear constraints.
Why This Matters for the Future of AI Trading
The results highlight an important shift in how AI may influence financial markets. Early experiments in AI trading focused on using a single powerful model to generate predictions.
PiP World’s experiment suggests a different direction: coordinated systems of specialized agents operating within strict risk controls may outperform isolated AI models.
Instead of relying on one super-model, the advantage appears to come from governed collaboration between multiple agents, each designed for specific market conditions.
If this architecture continues to prove effective, the next generation of trading platforms may look less like traditional algorithmic trading systems and more like AI-powered investment teams operating around the clock.
Data & Methodology
Period: Performance measured from Feb 12–27, 2026, covering a 15-day trading window.
Closed trades: The analysis includes 5,461 completed trades executed by the agents during the test period.
Active agents: A total of 43 PiP World AI trading agents participated in the experiment.
43 unique agent strategies: Each of the 43 agents represents a distinct trading profile built from six core dimensions: trading horizon, strategy, risk profile, timeframe, model, and prompt configuration. Strategy components draw from approaches commonly used by professional trading desks, including trend-following, breakout, momentum, reversal, and range-based trading.
Equal-weight aggregation: Overall performance is calculated by combining all agents into an equal-weight portfolio.
Trading universe: Agents traded across major crypto assets including BTC, ETH, SOL, XRP, BNB, LTC, LINK, and DOGE.
Market regimes: Market conditions were classified into TRENDING_UP, TRENDING_DOWN, MIXED, SIDEWAYS, and CHOPPY_VOLATILE.
Benchmark comparison: Buy-and-hold returns for BTC and ETH were calculated over the same period for direct comparison.
Execution guardrails: Risk controls such as position limits and stop-loss enforcement were applied at the execution layer.
Counterfactual simulations: Post-trade simulations tested how alternative risk policies (e.g., stricter gating) would have affected performance and drawdowns.
Training dataset: 8 million trader profiles and 295 million trades covering 28 years of continuous trading data (1998–2025) from PiP World’s lead backer, Exinity retail trading platforms Alpari and FXTM. Tracking crypto CFDs, spot trading on equities, metals and ETFs through events including: 216 Federal Reserve meetings, 6 major market crashes (exceeding 20% drawdowns), and four full interest-rate cycles from zero-bound to 5%+ and back.
Definitions
Decoding Our Agent Characteristics
In our charts the agents are named [Strategy]_[Version ID]_[Model]
[Strategy]
TF | Trend Follower: Ride the trend, keep it simple. |
MO | Momentum: Rides momentum waves early and exits before they fade |
BO | Breakout: Goes bigger on breakouts |
RE | Mean Reversion (Reversal): Buy in dips, sell on the rebound |
RA | Range: Calm when the market isn’t |
[Version ID]
V1 | Agent version 1 |
V2 | Agent version 2 |
[Model]
4.1 / 4.1m | GPT-4.1 / GPT-4.1 Mini |
4o | GPT-4o |
5 / 5.1 / 5.2 | GPT-5.x |
grok3 / grok3m | Grok-3 / Grok-3 Mini |
oss120b | GPT 120B |
Market Conditions
MIXED | Market alternates between short trends and reversals without a clear dominant direction. |
TRENDING UP | Prices move consistently higher over time with sustained upward momentum. |
TRENDING DOWN | Prices move consistently lower over time with sustained downward pressure. |
CHOPPY VOLATILE | Prices swing sharply up and down with high volatility and no sustained trend. |
SIDEWAYS | Prices move within a narrow range with limited momentum in either direction. |
Trading Terminology
R:R | Average risk/reward ratio per trade shows how much the strategy typically makes when it is right compared to how much it loses when it is wrong. |
Win Rate | The percentage of total trades that close profitably = profitable trades ÷ total trades |
Drawdown | Peak-to-trough equity decline shows how much capital would have been lost at the worst moment during the period, helping investors understand the level of risk and how severe losses became before performance improved. |
Sharpe Ratio | A measure of risk-adjusted performance that compares a strategy’s excess return to the volatility of its returns. A Sharpe Ratio below 1.0 indicates weak risk-adjusted returns, 1.0–2.0 is considered good, 2.0–3.0 very strong, and above 3.0 exceptional. |